

Ever wonder what the relationship is among growth, profitability, and stock price? Below, I try to calculate the relationship from first principles. Obviously, it is based on an idealized model, but I think you will find that it gives some insight. First let’s define some variables,
g cash generation growth rate (e.g., 7.5% per year peak year vs peak year)
p profitability as a percentage of revenue (e.g., 16% after taxes or 25% before taxes)
n year (counting from now: 0, 1, 2, 3, . . . )
d discount rate (e.g., 14%, the return the stock market demands from the company)
R0 revenue at year zero
NPV Net Present Value of the cash flow
For time dependant variables we have
R(n) revenue as a function of year with R0 = R(0)
C(n) cash generated as a function of year
DC(n) discounted cash as a function of year
So we have
R(n) = R0 (1+g)n
and
C(n) = pR(n) = pR0 (1+g)n
Now we need to do an aside on NPV, which we will use as a proxy for market capitalization or stock price. If you take a first finance course, they will quickly teach you that you should never directly sum funds from different years because a dollar today is worth more than a dollar tomorrow. This is why even essentially risk-free investments, such as US Treasury Notes, give interest. On top of that, most investments have risk. Thus the discount rate needs to also include a risk premium. The discount rate is essentially the interest you would need to compensate for risk and for delay. A typical mature high-tech large company discount rate is around 12% – 14%. Note that we are treating earnings (“the bottom line”) as cash. They are not the same, but it is not a bad simplification for the sake of this analysis. (There is an old saying, “earnings are an opinion, cash is a fact.” Mr. Market, that famous manic depressive, looks more at cash than at earnings.) The discounted cash flow DC(n) is therefore
DC(n) = pR0 (1+g)n/(1+d)n
Having applied the appropriate discount rate to the cash flows we can now calculate the NPV, that is, how much these future cash flows are worth. We have
NPV = pR0 [1 + (1+g)/(1+d) + (1+g)2/(1+d)2 + (1+g)3/(1+d)3 + . . . ]
To sum this infinite series, one needs a math trick. Let’s take a look. We have
1/(1-x) = 1 + x + x2 + x3 + x4 + . . .
where 0 < x < 1. ((To prove this to yourself, divide 1-x into 1 by long division.)) Using this trick with x = (1+g)/(1+d),
NPV/R0 = p(1+d)/(d – g )
for g < d. The next step is to ignore the term d because it is small compared to 1. We have
NPV/R0 ≈ p/(d – g)
This is where we needed to arrive. For a given discount rate, d, we can plot the tradeoff.
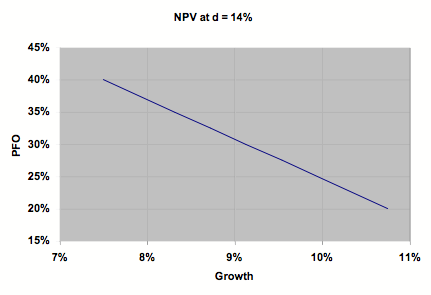
It is illustrative to work some examples: If we take a scenario with growth of 7.5%, a tax rate of 35%, and a PFO (profit from operations) of 40%, then we get a normalized NPV of 4.0. “Normalized” means divided by R0. If we then lower the PFO to 30%, to get the same NPV we need an increased growth rate of 9.13%. If we halve the PFO to 20%, to get the same NPV we would need a growth rate of 10.75%, and so on. If the stock market behaved ideally, then all of these scenarios would result in the same stock price. This is why Mr. Market likes high growth companies.
NPV gives us an easy way to get at another much-used parameter, the price-to-earnings or P/E ratio. If NPV represents the value to the future cash flows, then it also represents the ideal fair price one would pay for that cash stream. On the other hand, the present earnings is just pR0. Thus the P/E ratio, idealized, would be
(P/E)ideal = NPV/pR0 = 1/(d – g)
Note that this expression only depends on the growth rate and the discount rate. At d = 14% and g = 7.5%, the ideal P/E ratio is a little over 15. This number is very sensitive to d – g. At d = 12%, the P/E ratio moves up to a little over 22, which is one of the reasons executive managements work very hard to make their companies appear less risky to investors.
So what does this mean for your company? First, assuming you don’t lose market share, every percent of increased profitability that you can drive (averaged over the business cycle) should directly increase the stock price by that same percentage. This is why companies focus in the core on operational excellence. For mature markets where one is unlikely to grow market share, profitability is the place to focus. Second, keeping the results predictable makes the company appear less risky and thus earn a lower discount rate. This has a huge impact on the P/E ratio, which is why you see such obsession with hitting the numbers each and every quarter. On the other hand, for new areas, either inside your core or outside, it is rational to temporarily sacrifice some profitability for high growth, per the above formula, until the business matures and growth slows, when the focus must come back to operational excellence.
All of this analytical work is fine, but what are the limitations? The first is that we assumed that the discount rate, d, was constant when we did our scenarios, but obviously some strategies are higher risk than others. A more fundamental question is, where did this exponential model for risk come from and why should the exponent be linear in time? Unfortunately for me, but fortunately for the length of this essay, that is well beyond the scope of my understanding. On top of all this, the real market goes through cycles and is buffeted by many other forces and considerations. Still, I hope that the analysis above gives you some feel for why the company’s management behaves as it does as they try to maximize shareholder value.