
Over time, successful businesses develop models of how they operate that are self-consistent and self-perpetuating. For instance, one company will focus on differentiated products that command high gross margins while another will focus on operational excellence with razor thin margins and very high revenues. This is an important concept, like a continuity equation in physics. Basically all it says is that the business model of a company is self-consistent over time. Models can be constructed for companies that are relatively mature or ones that are growing, companies that are winning and companies that are losing, assuming that the business model is being kept relatively constant. And since business models are devilishly difficult to change, the applicability of such analyses is quite broad. Once this concept is grasped it can be used for a myriad of analyses beyond the one shown here. In this essay I will focus on understanding the self-consistent model of a high-margin business with large engineering spending, but the concepts can easily be generalized.
Let’s focus on a company or division or product line that has continuity over time. The simplified pre-tax Profit and Loss statement might look something like:
| Year 0 ($ in M) | |||
| Revenue (R) | $150 | 100% | |
| Cost of Goods Sold (COGS) | $65 | 43% | |
| Gross Margin (GM) | $85 | 57% | |
| Engineering (E) | $24 | 16% | |
| Engn research (ER) | $2.4 | 2% | |
| Engn development (ED) | $18.0 | 12% | |
| Engn sustaining (ES) | $3.6 | 2% | |
| SM&A (SMA) | $22 | 15% | |
| Profit from Operations (PFO) | $39 | 26% | |
Over time we need to grow. Let’s assume an annual growth rate g = 10%; then the revenue in the above example would be $150M, $165M, and $182M over three consecutive years, ignoring downturns. To be self-consistent, every dollar amount in the chart would also grow by 10%. Of course there would be pressures to not let costs grow but rather become more efficient and do more with the same or less, and there would be counter pressures to make some of these amounts grow faster because of increased competition. But for the sake of illustration, let’s assume that the business continues with these nominal percentages. That is, the business neither improves its model nor does it get worse. What does this model tell us about our engineering investments? To answer this question more accurately we need to decompose our engineering investment into three buckets: research ER, ED development, and ES sustaining. Let’s assume research is 10% of engineering and sustaining is 15%. That leaves three quarters of the engineering budget each year for new product development, including New Product Introduction (NPI) expenses. We will always be investing in new products and they will always be coming out and generating revenue and profit some time later. There are a couple of different types of engineering projects, incremental advances to existing product lines and the development of new platforms. The most common and prudent case is when the product is closely derived from the one before. In order to complete the model we need to pick an average time T between when the bulk of the development dollars are spent and when the bulk of the revenue starts coming in. This varies a lot in real life, but let’s pick two years for this example. The graph below shows development engineering expenses followed by revenue with about 8 quarters average delay.
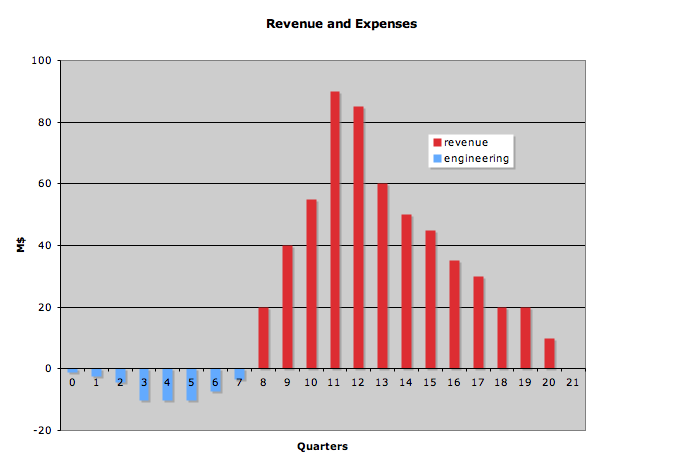
It could be a lot faster and, for new platform development, could be a lot slower. Note that with SAB101, revenue recognition is often quite separated in time from cash flow. One could use either metric, but, because it is revenue rather than cash that appears on the Profit and Loss (P&L) statement, we will use revenue in this example even though the company’s market capitalization might actually be more connected to the cash flow. Since we are always developing products and getting revenue (two years in this example) later, we can now connect the dots.
The development engineering we spend in year zero ED(0), $18M, must create $182M of revenue and $67M of profit two years later. That is, in general, ED(0) must generate a revenue of R(T) and a profit from operations of PFO(T), where
R(T) = R(0)(1+g)T
and
PFO(T) = PFO(0)(1+g)T.
The ratios are roughly 10 : 1 for revenue-to-development engineering and 2.6 : 1 for PFO-to-development engineering. Sometimes we talk about ROI. One common ROI formula is
ROI = (PFO + ED)/ ED
where E is engineering. It would be 3.6 in this example. We lose money when the ROI is less than 1. The three-year P&L might look like:
| *without risk discount* | Year 0 ($ in M) | Year 1 ($ in M) | Year 2 ($ in M) | ||||||
| Revenue (R) | $150 | 100% | $165 | 100% | $182 | 100% | |||
| Cost of Goods Sold (COGS) | $65 | 43% | $72 | 43% | $79 | 43% | |||
| Gross Margin (GM) | $85 | 57% | $94 | 57% | $103 | 57% | |||
| Engineering (E) | $24 | 16% | $26 | 16% | $29 | 16% | |||
| Engn research (ER) | $2.4 | 2% | $2.6 | 2% | $2.9 | 2% | |||
| Engn development (ED) | $18.0 | 12% | $19.8 | 12% | $21.8 | 12% | |||
| Engn sustaining (ES) | $3.6 | 2% | $4.0 | 2% | $4.4 | 2% | |||
| SM&A (SMA) | $22 | 15% | $24.2 | 15% | $26.6 | 15% | |||
| Profit from Operations (PFO) | $39 | 26% | $43 | 26% | $47 | 26% | |||
| riskless | |||||||||
| R(2)/ED(0) | 10.1 | ||||||||
| PFO(2)/ED(0) | 2.6 | ||||||||
| growth rate | 10% | ||||||||
We are almost done. We must include a risk factor because we have learned through painful experience that engineering programs are not without risk. Let’s add a 21% per year risk premium d to cover the uncertainty (including schedule and cost uncertainty). This has the effect of increasing the revenue and profit we are shooting for to compensate for the risks we are incurring. The target revenue R(T) before being discounted is thus
R(T) = R(0)(1+g)T(1+d)T
and the target profit at time T is
PFO(T) = PFO(0)(1+g)T(1+d)T
This means that for us to keep this business humming along with the same profitability, we need to aim for a 15 : 1 ratio for revenue and a 3.8 : 1 ratio for PFO (or a ROI target of 4.8). As you can see, just to sustain our business model, every $1 of engineering must aim to produce $3.80 of pre-tax profits two years later. This numbers go up a lot for projects that require more development time and have more risk.
Note that this analysis can be applied to any profit making operation in the company, e.g., sales or marketing.
From this you can see why companies behave the way they do in several areas. Why do companies outsource a lot? Because they presume that they can spend those development dollars better elsewhere. If one is going to do it oneself, one had better save $4 for every $1 invested. Same goes for cost reduction efforts after the product is released. Better do them up front. Products only last a few quarter anyhow. It is also why companies hate customer “Specials.” A high-margin company finds it extraordinarily difficult to make the business model work with lots of specials.
I am sure your business does not look like these made up numbers. Here is the spreadsheet so you can try it yourself. [Download Excel file without macros] Look at the last page to see a study in sensitivities.
Raise the risk premium to 25% (not completely unreasonable, target ROI = 5.1). Increase the time to do projects by a year (target ROI = 6.1). Grow at 15% (target ROI = 5.2). Try all of the above (target ROI = 7.4). Be the general manager (priceless). Enjoy.